Customer
Problem:
"We have an
existing wireless
network at our plant
in Dallas and are
experiencing
connectivity issues.
We are using the
Motorola MC9190-G
Mobile Computer for
inventory control
and are looking to
have a site survey
to analyze the
coverage on site.
The MC9190-G is
having problems
running the Web
Application. We
intermittently
receive a web page
not found error and
are not able to
enter data into the
inventory control
system. HELP!"
Wireless LAN
(WLAN) Interference
In practice,
interference in WLAN
applications usually
manifests itself as
reduced data-traffic
throughput, less
effective range, and
impaired quality of
service (QoS) for
voice and video
applications, but
can also include the
complete failure of
a given link or
wireless network.
The cumulative
effects of
interference may be
identifiable by
analyzing network
management logs, but
diagnosing these
symptoms in this
manner can be very
difficult because
they can also result
from other network
related problems.
This situation
further motivates
the use of
specialized tools
for identifying and
evaluating the
sources and effects
of interference.
With respect to
WLANs, interference
can come from a
variety of sources.
Interference from
other WLAN networks
is typically
co-channel
interference (CCI),
usually between two
access points on the
same channel, or
adjacent-channel
interference (ACI)
resulting from two
access points
operating on
abutting or
overlapping
channels. Since
WLANs employ a
“listen-before talk”
protocol, based on
Carrier Sense
Multiple Access with
Collision Avoidance
(CSMA/CA), any
interference between
WLAN networks tends
to work out somewhat
cooperatively, with
the two networks
often sharing
channel capacity as
noted above. In
contrast,
interference from
non-WLAN sources,
which use protocols
different from those
of WLANs, more often
result in the
degradation of WLAN
transmissions. There
are numerous
non-WLAN devices
that operate in the
unlicensed bands,
including Bluetooth
products of many
forms (some
operating at the
same power levels as
WLANs), cordless
phones, wireless
video surveillance
cameras, wireless
security and energy
management systems,
proprietary wireless
bridges, and
computer peripherals
such as cordless
mice, keyboards, and
game controllers. In
addition, there are
emissions from
commercial and
industrial devices
such as microwave
ovens, certain RADAR
systems, and even
microwave-based
lights.
One approach to
dealing with
interference is to
move to another
band, most obviously
the 5 GHz spectrum
used for 802.11a and
802.11a/n. RHO
Wireless recommends
deployment using
both the 2.4 GHz
band of 802.11b/g/n
and the 5 GHz band
of 802.11a/n and the
next generation
802.11ac. Not just
because the 5 GHz
spectrum is
currently less
likely to suffer
from interference;
but, there are 21
non-overlapping
channels defined in
the 5 GHz WiFi
spectrum in the US
(as compared to just
three
non-overlapping
channels in the
2.4 GHz band). This
offers significantly
more uncongested
capacity. The 5 GHz
spectrum has been
underutilized
primarily due to a
lack of familiarity,
and a general belief
that transmissions
at 5 GHz have less
range than those at
2.4 GHz. While it is
true that 5 GHz
signals do not
propagate as far as
signals at lower
frequencies, the
throughput increase
of using of
802.11a/n networks
brought about by
channels bonding and
multiple input and
output streams far
exceeds that of
802.11g and
802.11g/n networks.
Problem Analysis
The first thing
we asked for was a
site plan showing
the deployed access
point locations, the
type and model of
the access points
installed, the
access point
operating channels
and the access point
operating power
levels. The
installation was
completed 6 months
previously and the
wireless network had
"never met the our
expectations". The
wireless installer
had not completed
either a
pre-deployment nor
post deployment site
survey. The
installer "just
placed the access
points where they
thought they were
needed".
Unfortunately, this
mistake is made far
too often and may
result in coverage
holes, or, more
likely, severe
co-channel
interference. The
customer was using
Cisco
AIR-AP1141N-A-K9
which is a
single-band
Standalone
802.11b/g/n Access
point which operates
in the 2.4 GHz band.
Thus, there are only
three
non-overlapping
channels available
for use in the
wireless network.
The customer's
plant was using half
of a building with
the other half
reserved for plant
growth. Total
operating space was
267,000 square feet
with wireless
coverage provided by
eleven access
points. Since there
are only three
non-overlapping
channels and there
are eleven access
point, there was a
strong potential for
co-channel
interference from
eight of the eleven
access points; plus,
the the interference
introduced by the
customer's
neighbors' WiFi
networks.
We conducted a
Predictive Analysis
of the customer's
facility using the
AP locations, power
settings and
channels provided by
the customer. The
wireless installer
had not provided a
map of the AP
locations and the
customer could not
locate one access
point. So we
"guessed" at the
location of the
missing AP on the
the virtual site
survey used for the
Predictive Analysis.
Predictive
Analysis Results
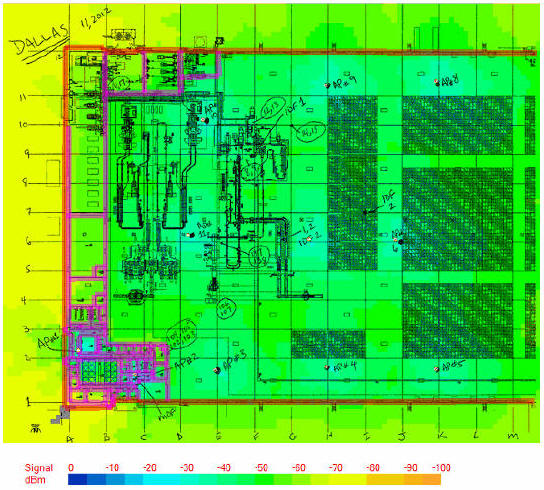
Predictive
Analysis signal
levels showing
excellent signal
strength and
coverage
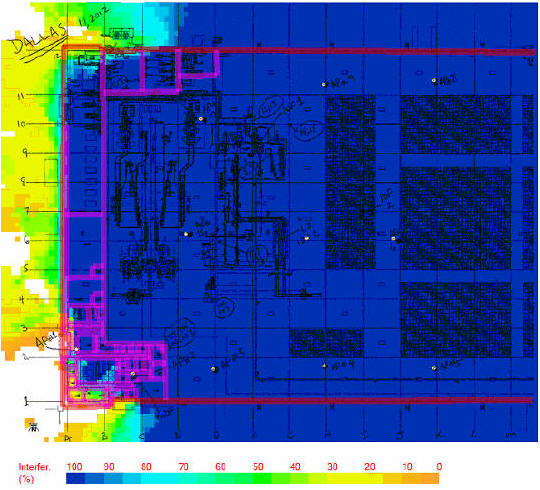
Predictive
Analysis indicated
that severe
Co-Channel
Interference
was to be
expected
But, what
is the real
coverage? What's the
real-life
performance? Are
there coverage
holes? Are there
really interference
issues? What's
the interference
from the surrounding
area? Only a Post
Deployment site
survey can provide
the answers.
Post Deployment
Site Survey
A post deployment
site survey was
completed with
results that
mirrored the
Predictive Analysis
except:
- Two
additional
customer 2.4 GHz
band access
points were
discovered. They
had been
installed by the
customer prior
to the
implementation
of the wireless
network plant
wide.
- Since no
previous
site survey
had been
conducted,
the legacy
access
points had
not been
identified.
- Actual
access point
locations of
some of the
access points
was slightly
different than
that provided.
- Actual
location of the
"missing" access
point was
determined.
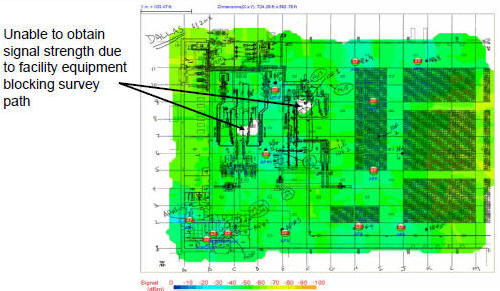
Site Survey
Signal Strength and
Access Point
Locations
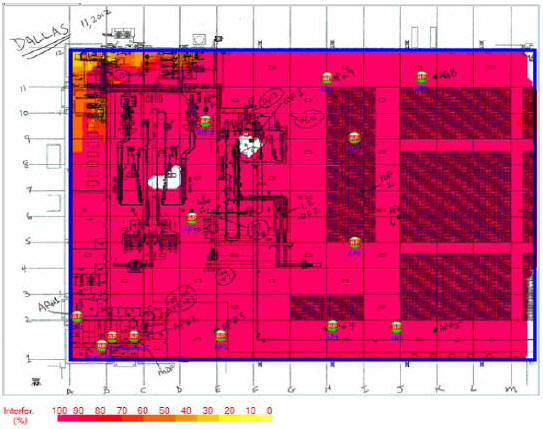
The site survey
indicated that there
was severe
Co-Channel
Interference
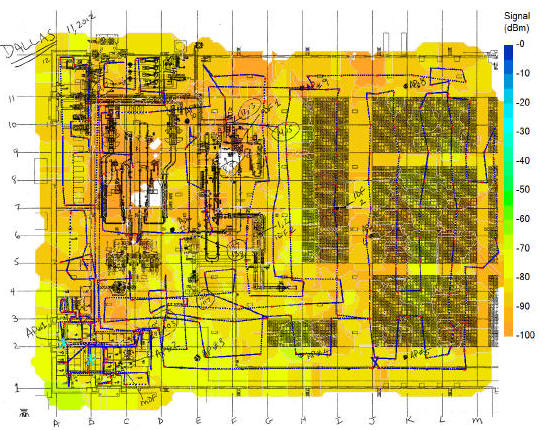
2.4 GHz
Interference from
Neighboring
Facilities
Recommended
Solution
Since the access
points were already
installed, cost
precluded moving the
needed access points
to an optimum
location or
deploying a
dual-band network.
So, another
Predictive Analysis
was performed using
the actual access
point locations,
disabling access
points that were not
needed, and
adjusting the access
power levels to
minimize the
predicted co-channel
interference. Five
out of the eleven
access points were
used with the new
power settings
implemented. Eight
access points were
disconnected from
the network (Six
Cisco
AIR-AP1141N-A-K9
access points and
two legacy access
points).
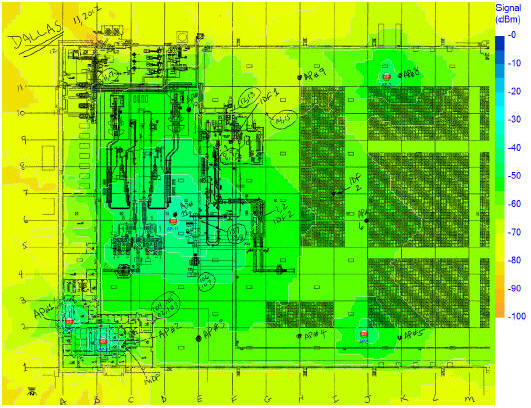
Recommended
solution predicted
signal levels
showing signal
strength and
coverage
that meet the
customer's
requirement
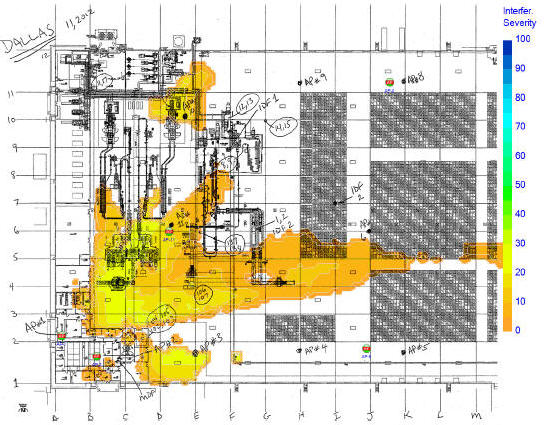
Recommended
solution showing the
Co-Channel
Interference
was minimized to an
acceptable level
Conclusion
Wireless network
installation is a
complex task that involves
many invisible and
unpredictable
variables such as RF
signal strength,
noise level, data
rate, channel
allocation, user
density, and so on.
Since all these
factors ultimately
affect wireless LAN network
performance, you
should always have a site survey
performed before
installing your wireless
network to
fully understand the
behavior of radio
waves within your
facility. This will
minimize your
installation costs
and ensure that you
have a wireless
network that meets
you expectations.
RHO Wireless
uses the Fluke
AirMagnet Site
Survey Pro software
application and our
experience to
determine the
optimal number and
placement of
wireless LAN access
points.
- - Have AP,
Will Travel! - -
|